Memory Usage Profiler
Advertisement
DotTrace Memory 3.5 B v.360.114
dotTrace Memory lets you discover memory leaks and optimize memory usage in applications based on .
Advertisement

.NET Memory Profiler v.4.5.173
.NET Memory Profiler is a strong tool for finding memory leaks and optimizing the memory usage in programs written in C#, VB.NET or any other .NET Language..NET Memory Profiler is available in two editions: Standard and Professional.
JavaScript Memory Validator v.2 3
JavaScript Memory Validator provides automatic memory usage analysis of applications as they run. There is no need to modify your application. JavaScript Memory Validator works with information provided by the JavaScript Tracing API.
Usage Monitor v.2.0.0.4
Usage Monitor lets you set watch limits on processes to know when your process is using too much. Watch limits can be placed on Memory Usage, GDI Objects, and USER Objects. This is a great tool for any developer.
My Memory Monitor v.1.02
My Memory Monitor shows physical memory usage in real time in the systray area and on screen.
Memory Restart v.1 1
Memory Restart is an open-source Firefox Add-on. Firefox users will see the browser's memory usage in the status bar. Once memory usage reaches a certain threshold, the status bar text display will turn red,
Memory Meter v.0.2
Memory Meter is a Firefox extension, can display a small graph of available memory in the Add-On Bar. It will also display detailed statistics regarding the memory usage (mapped memory and memory in use).Requirements: * Firefox * Firefox for Mobile *
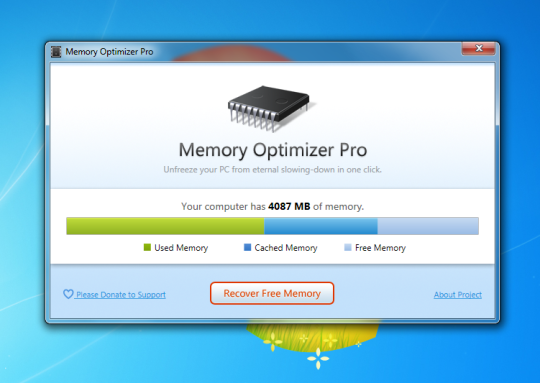
Memory Optimizer Pro v.1.1.0
Understand your computerOCOs memory usage and keep it under control OCo Memory Optimizer will graph your computerOCOs memory showing you whatOCOs using it and giving you an easy way to optimize itOCOs usage.
JProbe v.8 3
JProbe is an enterprise-class Java profiler providing intelligent diagnostics on memory usage, performance and test coverage, allowing developers to quickly pinpoint and repair the root cause of application code performance and stability problems tha